
Learning Portal
Along the 100 miles of Georgia’s coastline, you will find over a half-million residents, millions of annual tourists, and countless animals in the land, sea, and air. All of them depend on water. In order to protect this essential resource, the IWH co-creates research questions with community members and makes connections to build practical solutions at the intersection of water and health.
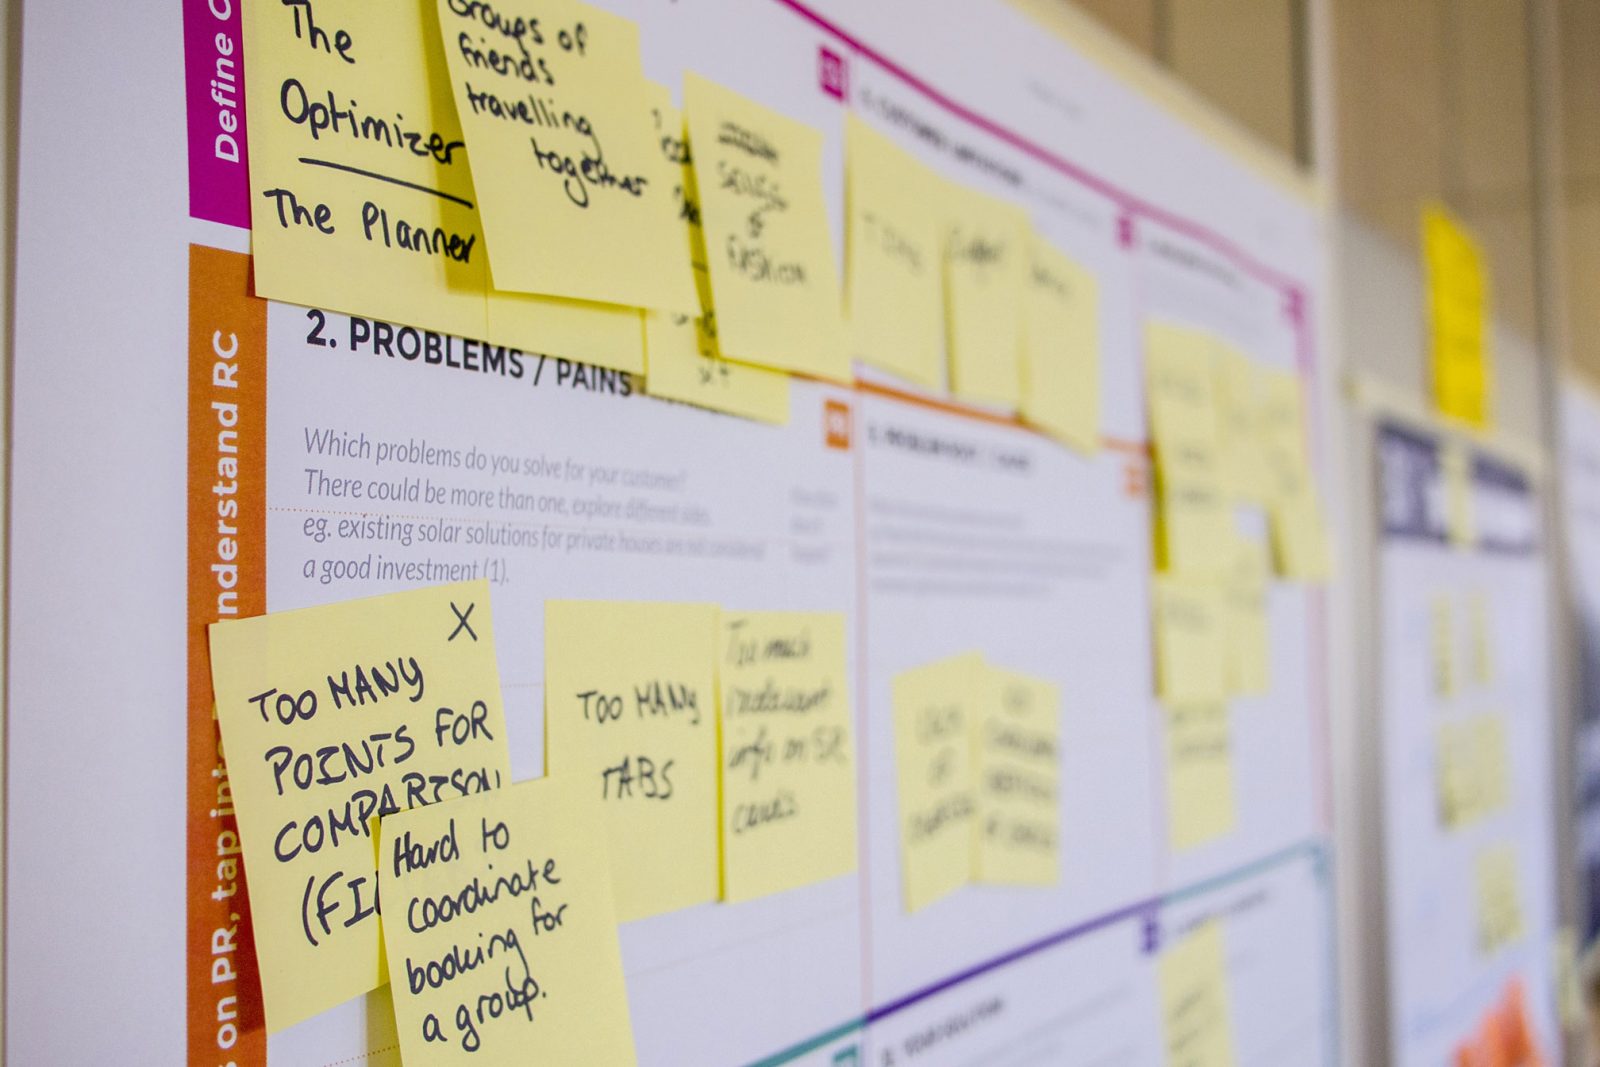
Who wants to work in a field where you have all the answers?
Lucia Pérez-diaz, geologist
Topics
- Drinking Water
- Wastewater
- Stormwater
- Agriculture
- Aquaculture
Resources
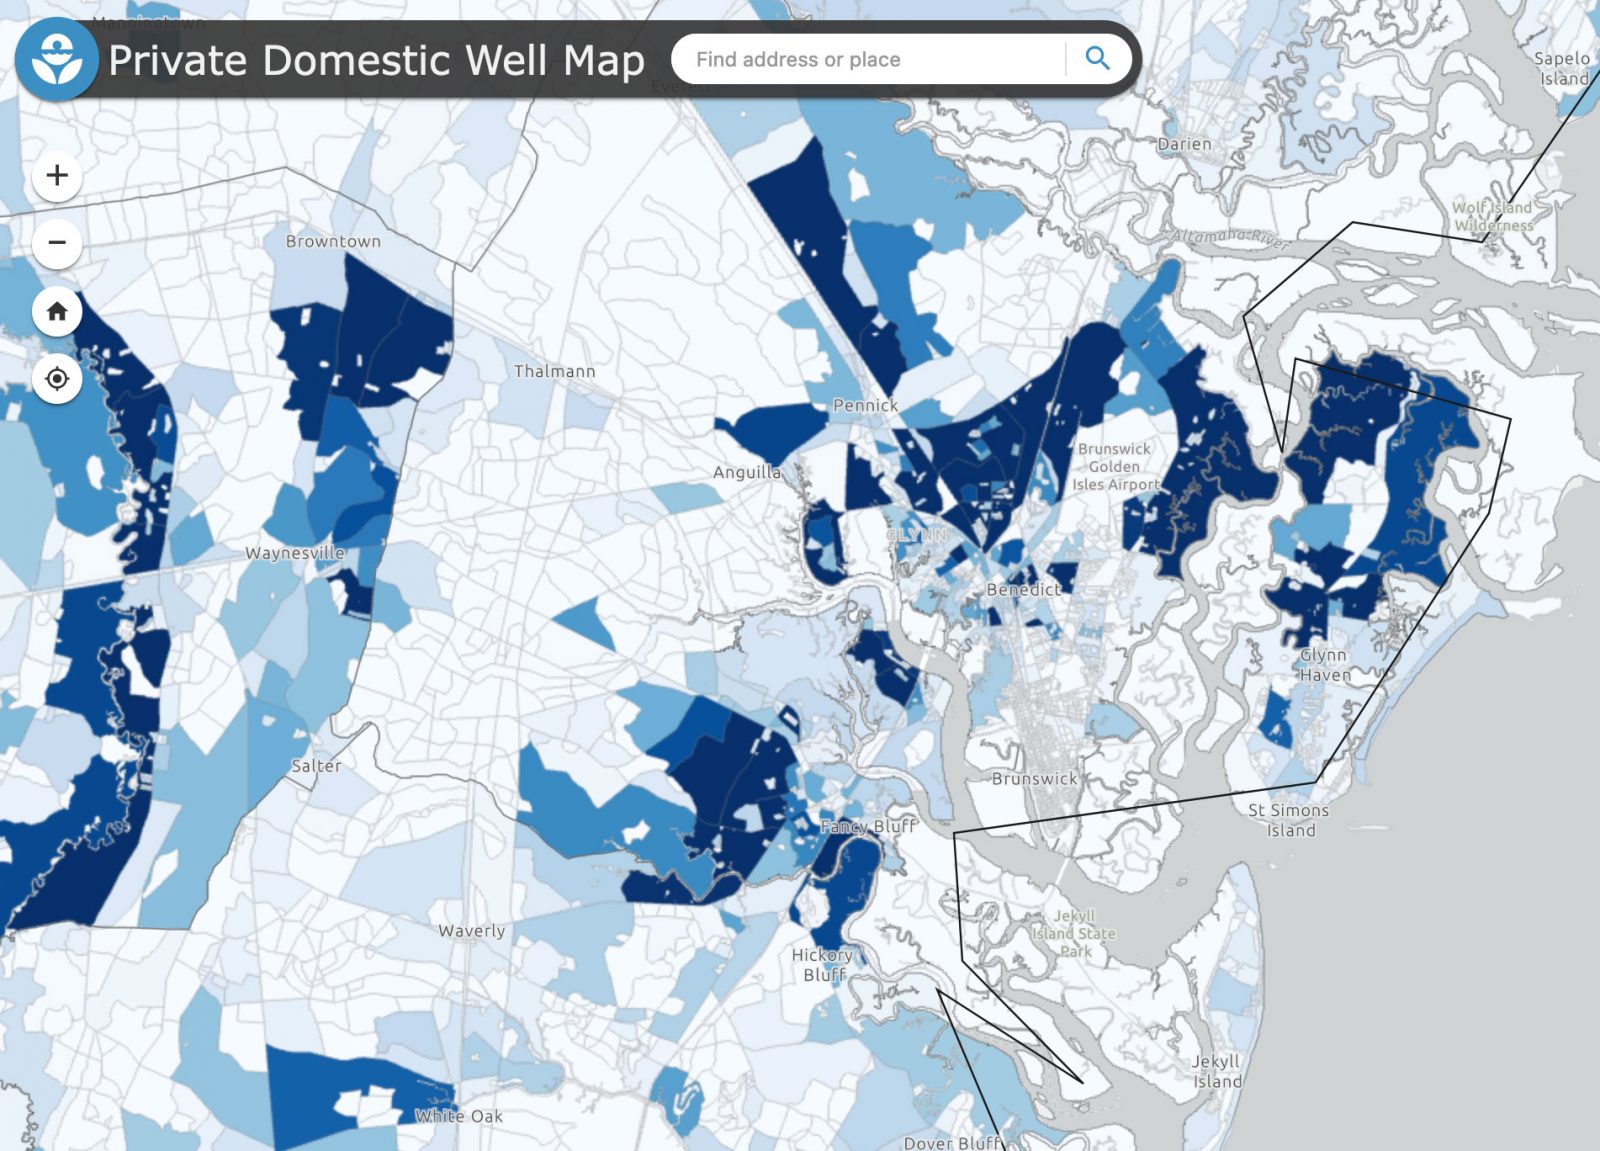
Geospatial data about water infrastructure, environmental justice, and other keys to improving public health
Ask Us A Question
Our research questions are co-created alongside communities, educators, policymakers, and managers.
Featured Article
Exploration of Epidemiology Data in Water Resources
By Timothy Kizza
Secondary data (that is, collected by an outside group) is extremely important in public health and allows for a diverse set of research questions from large datasets. If a researcher wishes to explore epidemiological data but doesn’t know exactly where to find sources that have been conducted in natural environments, then the answer might be with the data-exploring platform: Clinepidb.org.
ClineEpiDB is an open-access data analysis platform that has been in existence since 2018. It contains data from epidemiological studies through a variety of visualization tools. Through this platform, a user is presented with a point-and-click web interface that provides exploratory data capabilities into the different variables and associations between different variables in a particular study. Studies included on this platform range from experimental and observational cohort studies to different case-control, randomized and non-randomized trials, and studies from countries in Africa, Asia, and South America. In addition, users can also bring their own data and use visualization tools without having to share their data with the public.
To illustrate the usefulness of this platform, we explore an example that can be done by looking at the Global Enteric Multi-Center Study (GEMS) Study that was conducted in The Gambia, Mali, Bangladesh, Kenya, India, Pakistan, and Mozambique. The GEMS was a prospective, multicenter, case-control study of acute diarrhea in children 0-59 months of age. Each site recruited cases with severe diarrhea from hospitals or ambulatory facilities and up to three matched community controls per case. Participants were assessed at enrollment and on a 60-day follow-up visit.
In this example, we would like to compare Diarrhea episode duration for different water sources to establish if there is any kind of relationship and whether it is significant or not by using different visualization tools. This kind of exercise is important to prioritize which groups need more infrastructure funding or attention from public health programs.
Relation between participant proportion and piped water. (Using a mosaic plot)
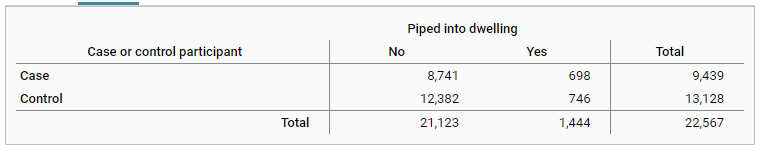
In this example, we used a mosaic plot of variable ‘Diarrhea episode duration among study participants (which is split between control and case) against a water source piped into dwelling, like a sink. Below is a summary of the results:
There were 21,123 observations with no piped water and 1,444 observations with piped water of which, 9,439 were case (meaning diarrhea) participants and 13,128 were control (no diarrhea) participants.
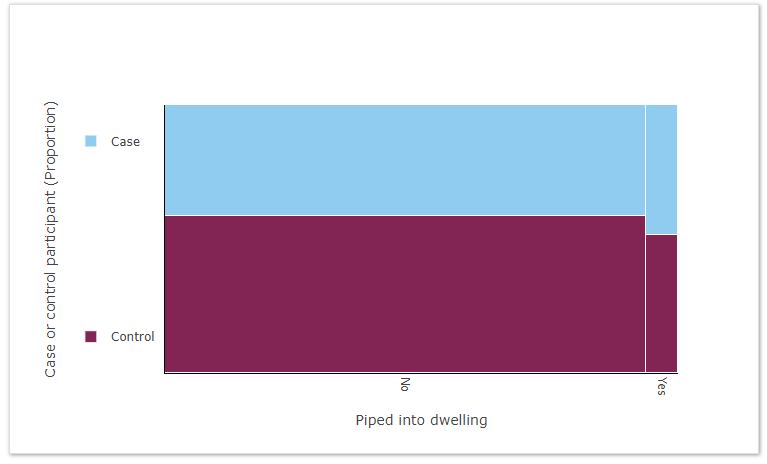
It is observed that there are more cases in the group where water is piped into the dwelling than there are for all other water sources. Cases have moderate to severe diarrhea while controls have no diarrhea.
Conclusion
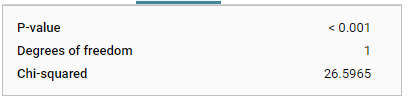
Our results are significant and we can conclude that there may be a relationship between ‘Diarrhea episode duration among participants’ and ‘piped into a dwelling. This goes against our initial assumption that fresh water that is piped into a dwelling is always safer than outside sources. We could investigate further by replicating the same plots for all other sources. The type of sample site is a confounder, i.e., a variable that could skew results in a way that obscures the true relationship.
All the graphs in this article are accessible at: https://clinepidb.org/analysis/KAyt9FC
Previous Articles

Coastal Georgia
Water availability has been a significant challenge in Coastal Georgia as the majority of the water resources are dependent on the Floridan Aquifer, once known as one of the most productive water resources in the United States. This resource is shared by neighboring states and contributes to 62% of water usage for industrial, municipal, and agricultural needs in Georgia.
The Coastal Georgia Region is a powerful economic attraction for companies, with the fourth largest seaport in the U.S. The region is home to growing aerospace, manufacturing, logistics, and military industry sectors in addition to existing industries such as paper and pulp manufacturing, mining, and tourism. Such growth and diversification in economic development mean more population growth and more industrial and municipal demand for water.
The Coastal Georgia Region (nine counties including Bryan, Bulloch, Camden, Chatham, Effingham, Glynn, Liberty, Long, McIntosh), drives with a population over 714,000, is one of the fastest-growing regions in Georgia and the country, with a projected 32% population increase in the next three decades.
In addition to population growth, sea-level rise resulting in saltwater intrusion has created more stress in terms of water availability for consumption. As the population and water demand increase, there is greater urgency for new and innovative techniques, materials, technologies, and delivery methods to improve the infrastructure and address future challenges in water resource management.
High water demand also means increased wastewater production and treatment. Wastewater treatment plants are typically located in areas with lower elevations and in close proximity to streams, which are at a high risk of flooding from extreme rain events. This threat is heightened along Georgia’s coastline, which is vulnerable to extreme weather. These events may result in sewage spills or septic system overflows that threaten public health arising from exposure to contaminated floodwaters. Protecting water quality in streams, rivers, and lakes is therefore becoming more challenging due to increased wastewater production, non-point source pollution, stress on stormwater systems, and rainfall followed by flash drought conditions, where more concentrated contaminants enter water systems.
Last updated: 2/9/2023